
How to Collect Doppler Data With Your HF Radio
Alternate language options:
French: Français
Norwegian: Bokmål
Russian: русский
Doppler Shift
Radio signals provide a window into the changing ionosphere. The various signals from WWV, reflecting off the ionosphere, undergo changes in path length as the ionospheric electron density profile changes. This results in changes to the observed frequency of radio signals at receiving points, akin to the rise and fall in pitch of a passing train whistle.

Signals from radio station WWV reflect off the ionosphere in this illustration. Space weather affects how far a signal travels before it changes direction, and the receiving station detects this as a change in signal frequency.
Comparing the received radio signal with a precision local frequency standard, such as a GPS-disciplined oscillator, allows a user to measure these ionospherically induced frequency shifts. This measurement is prepared and recorded with open-source software. Numerous data sets recorded simultaneously from multiple locations offer information—when these data sets are examined both individually and collectively—about the ionosphere at the time the data are taken. This information includes the movements of traveling ionospheric disturbances and other important phenomena at various scales.
You can read more about how these measurements work here.
Collecting Doppler Data from Your Station
If you have an SDR, consider https://github.com/ccera-astro/wwv_doppler.
There are two ways to collect Doppler data from the audio output of your HF radio. One is to collect .CSV data using a frequency analysis program - this is best for long-term data collection. The other is to collect audio files, which is recommended only for short-term experiments such as eclipse festivals.
You will need:
- An HF radio and antenna capable of receiving signals from time standard stations
- A computer
- A sound card interface, like this one, to connect your computer to your radio. (How to check that your USB
External Stereo Sound Adapter is good for radio ? ) - A GPS-disciplined oscillator (GPSDO), like this one, to ensure the precision of your measurements
The method for connecting the GPSDO to your radio will depend on what kind of radio you have. Whether you know how to set this up or are wondering how to approach it, please sign up on the crowdsourced spreadsheet here: https://docs.google.com/spreadsheets/d/1v4Aj5zgLVIgvqlmqiaU29mlfxH4AIzBTQVkPwA5BxhI/edit#gid=0
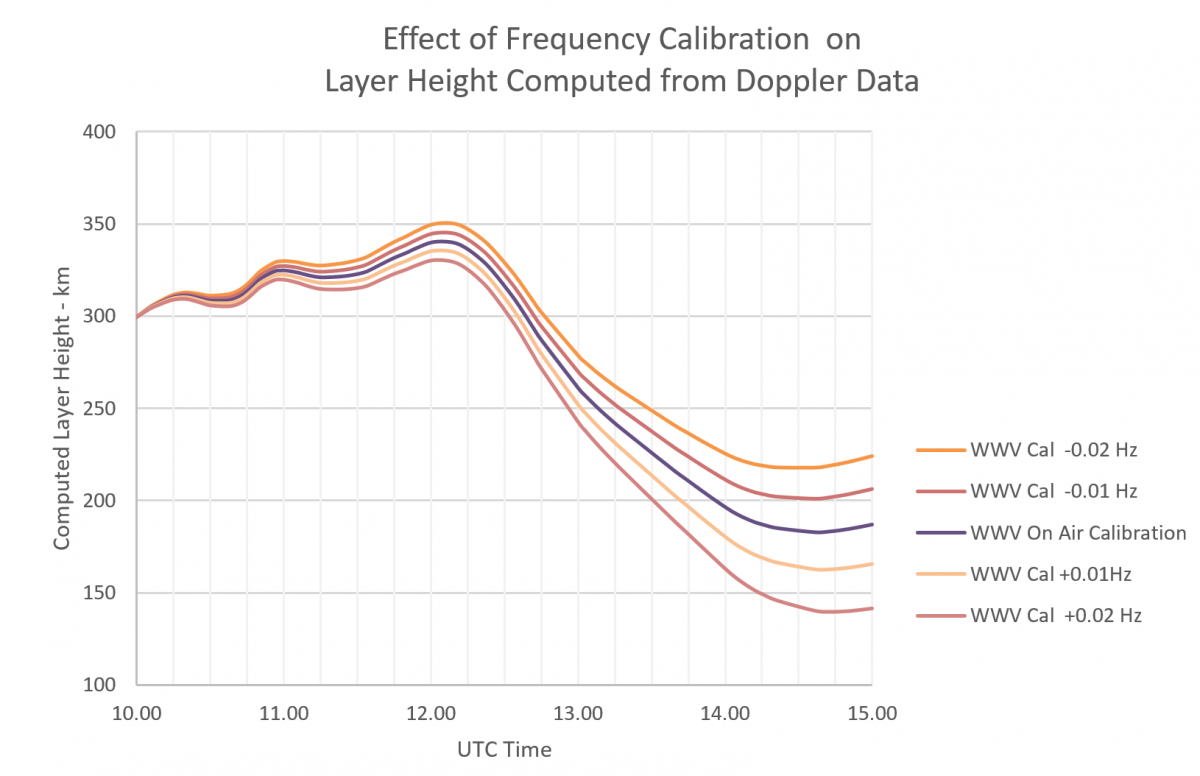
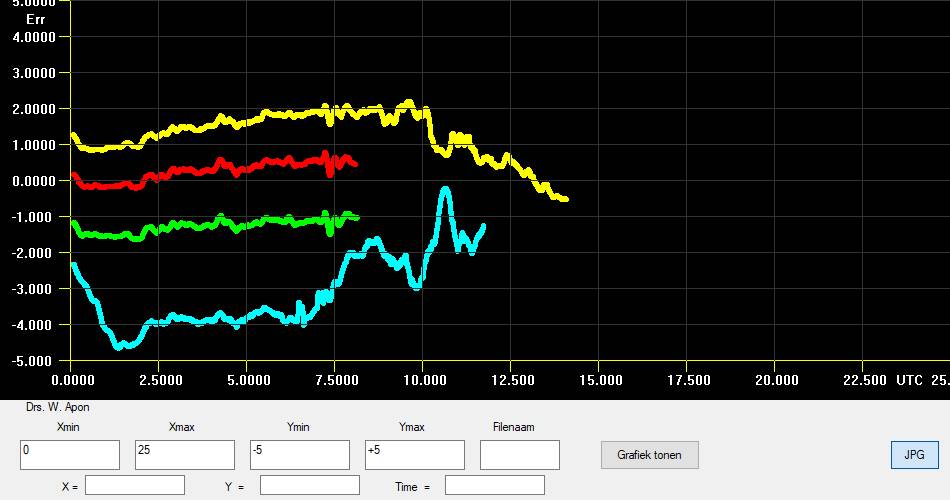
It is possible to collect data without a GPSDO, but your measurements will be much better with one. While you may be able to see trends in your data, you will not be able to make a quantitative estimation of layer height. As this chart by Steve Cerwin WA5FRF shows, a small error in your local oscillator frequency translates to a large error over time when estimating layer height:
Selecting a Beacon Frequency
You will want to record a beacon frequency that can be heard from your station. The examples on this page use 10 MHz. You can find a list of time standard stations here.
Radio time signal stations in the world with shortwave transmissions that you can use for Eclipse Festival of Frequency Measurement :
Africa :
None with shortwave transmissions.
African countries in the northern hemisphere : use RWM in Russia
African countries in the southern hemisphere : try to receive one of the time signal stations in South America,
else use RWM in Russia
Asia :
* BPM, China, Shaanxi, Pucheng (central China)
2.50 MHz, 5.0 MHz, 10 MHz, 15 MHz (Power in kW unknown for each frequency)
* HLA, South Korea, Daejeon
5.0 MHz (2 kW)
Europe :
* RWM, Russia, Moscow, Taldom (east of Europe)
4.996 MHz (10kW), 9.996 MHz (10kW), 14.996 MHz (10kW)
North-America :
* WWV, United States, Colorado, Near Fort Collins (central United States of America)
2.50 MHz (2.5 kW), 5.0 MHz (10 kW), 10.0 MHz (10 kW), 15.0 MHz (10 kW), 20 MHz (2,5kW), 25 MHz (2,5kW)
* CHU, Canada, Ontario, Ottawa (in the south east of Canada )
3.33 MHz (3 kW), 7.85 MHz (10 kW), 14.67 MHz (3kW)
Oceania :
None with shortwave transmissions.
Use WWVH in Hawaii or BPM in China
Pacific Ocean
* WWVH, United States, Hawaii, Kekaha (in the center of the north pacific ocean)
2.50 MHz (5 kW), 5.0 MHz (10 kW), 10.0 MHz (10 kW), 15.0 MHz (10 kW)
South America
* LOL, Argentina, Buenos Aires
10 MHz (2 kW)
* PPE, Brazil, Rio de Janeiro, Rio de Janeiro
10.0 MHz (1 kW)
* YVTO, Venezuela, Caracas
5.0 MHz (1 kW)
Recommendations for choosing the best radio station
1) use the nearest transmitter on your continent
2) use the frequency with the most power (in kW) if you can
3) for choosing the frequency to receive, try :
For continental and national radiocommunications we can summarize
- at night: bands from 3 MHz to 9 MHz,
- by day: bands from 5 MHz to 16 MHz.
For regional and departmental radiocommunications we can summarize
- at night: 0.3 MHz to 5 MHz band in Europe, 2 MHz to 6 MHz band in the tropics,
- by day: 0.3 MHz to 8 MHz band in Europe, 4 MHz to 12 MHz band in the tropics.
More detailed information by frequency band :
The propagation of electromagnetic waves depends of course on the medium but also on frequency. The ranges quoted below are given as an indication, the ionospheric propagation conditions being highly variable depending on the solar cycle, the time of year,the region of the world, the time of day, the circuits ...
Below 4 MHz: Communications are generally only possible at great distance when it is dark between the place of transmission and reception, after the disappearance of layer D. The ground wave has a predominant function, especially in below 1 MHz. Excellent regional strip at the start and end of the day with a range of up to 600 km (up to 2,000 km depending on conditions). Local connections can take place within a radius of a few tens of kilometers. Communications possible without jump distance in NVIS radiation.
4 to 8 MHz: intercontinental communications are possible (over 4000 km) but reliable links can generally only take place between 200 and 3000 km. Local connections possible up to about thirty kilometers. Communications possible without a zone of silence in NVIS radiation (Sky Wave with Quasi Vertical Incidence) with a range of less than 400 km for the lowest frequencies of this portion of the spectrum.
8 to 12 MHz: Open 24 hours a day for continental communications. Jumping distance from 300 km during the day to 1,000 km at night. Intercontinental communication possible when it is dark between the place of emission and reception.
12 to 16 MHz: Band open during the day with a range of up to 2000 km at all times. Communications possible to the antipodes during favorable periods of the solar cycle. Jumping distance varying from 200 km during the day to 1,600 km at night.
Approach #1: Collecting .CSV Data With fldigi
- Download fldigi, install it, verify that it's working correctly. Find the "frequency analysis" module in the "op mode" pulldown menu.
- Tune your radio (in AM mode) to a time standard station on 10 MHz, and determine which you can easily measure.
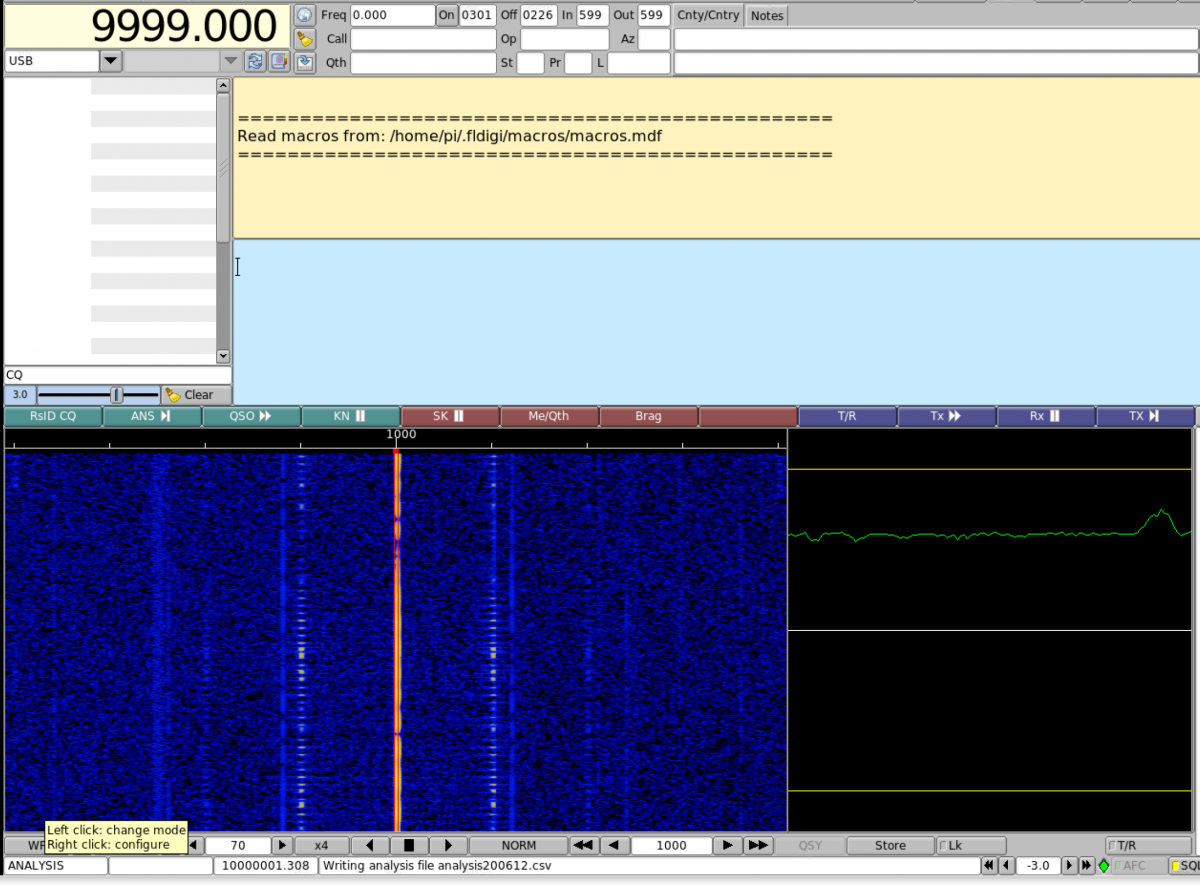
- Set your receiver's mode to USB (upper sideband) and tune to a frequency 1kHz below the carrier. For 10 MHz, tune to 9.999 MHz (9999.000 kHz - see image) and listen for the 1000 Hz tone.
- In fldigi, make sure that the tuned frequency in the upper left-hand corner is the same as your radio's frequency. To change it, click on the top half of a digit to increase it or the bottom half to decrease it.
- Look for the 1000 Hz line on fldigi's waterfall. Click the cursor there or use the offset frequency box at the bottom of fldigi's screen. You must set the number in the box at the bottom of the screen to exactly 1000. (If fldigi doesn't take this input properly, try starting the recording and then setting to 1000.)
- In fldigi, select the "Op Mode" menu and select "Freq Analysis" mode.
- Look for "writing CSV file" on the lower line of fldigi, toward the left. If you have a clean signal and see only one carrier, you should see a nice plot at the end of the day. If you see multiple carriers, more detailed Doppler information may be needed.
- Now, leave fldigi alone. While collecting data, leave your radio alone and make sure your computer is not shut down by an automatic update.
- At the end of your recording period, close fldigi. The file "analysis.csv" should be in your /fldigi/temp/ directory. Alternatively, they may be under "/fldigi.files/analysis". In MacOS, they are in the hidden directory ~/.fldigi/analysis - to find them, you must unhide the files using CMD + SHIFT + . in Finder. At the end of the data collection period, you should have one analysis-*.csv files for each day of data recording. Please rename these files by adding your name or callsign: e.g., analysis_200620 - W8EDU.csv. Do not edit the content of the files.
Approach #2: Collecting Audio Data With Audacity
Note: This approach is for short-term data collection, such as during eclipse festivals. For long-term data collection, we recommend using fldigi as described above.

- Under Artist Name, put your callsign. (If you are a shortwave listener and not a ham, please use your name or SWL callsign.)
- Under Album Title, put the name of the event - e.g., "December 2020 Eclipse."
- Under Year, 2020.
- Under Genre, put your radio model.
- Email Address
- Rig
- Antenna
- Sound Card
- Frequency
- AGC (on or off)
- Latitude (please use decimals, not minutes and seconds!)
- Longitude
- Elevation (m)
- Time zone (Format example: UTC-05:00)
- Grid Square
- Country
IMPORTANT: If you have multiple radios collecting data simultaneously under a single callsign, add a hyphen and station number for each station wherever you would otherwise use the callsign. For example, if station W8EDU is running data collection simultaneously on a Flex radio and an Icom radio, they should label one as W8EDU-1 and the other as W8EDU-2, include a comment in the metadata for each station explaining that the operator ran multiple stations, and make sure that the metadata is correct and complete. This will make it much easier to sort through the data from the experiment during the analysis phase.


- With AGC enabled, set up the radio to produce the 1000 Hz tone in USB mode by tuning the radio 1 kHz below the carrier frequency (e.g., 9.999 MHz for a 10 MHz carrier).
- Set the receiver volume control for a comfortable listening level using the radio’s normal speaker or headphones. It should be loud enough to be above the no-signal receiver noise but not so lout that it causes distortion.
- Set the recording level in Audacity to get approximately 1/4-1/2 full scale recording level, or at the level that leaves about 6 dB to 10 dB of headroom below full scale.
- Turn the receiver AGC OFF.
- Use the RF gain control to set the audio output to the same level as with the AGC ON.
- Make a day-long recording and examine the record. If the levels reached full scale at any time during the recording, reduce the RF gain control and try again. The idea is to have enough RF gain get measurable signal levels even during the weakest part of the day but not so much that the amplitude at the strongest part of the day hits or flattops at full scale.
- Once the RF gain is set it must not be changed while recording eclipse data.
- When submitting your data survey below, make sure to confirm that you performed this procedure.
Once you're all set, your setup should look something like this:
Analyze Your Data
You can plot your data over time to see geophysical trends. If you are receiving a clear signal, the sunrise should show up clearly in your frequency data.
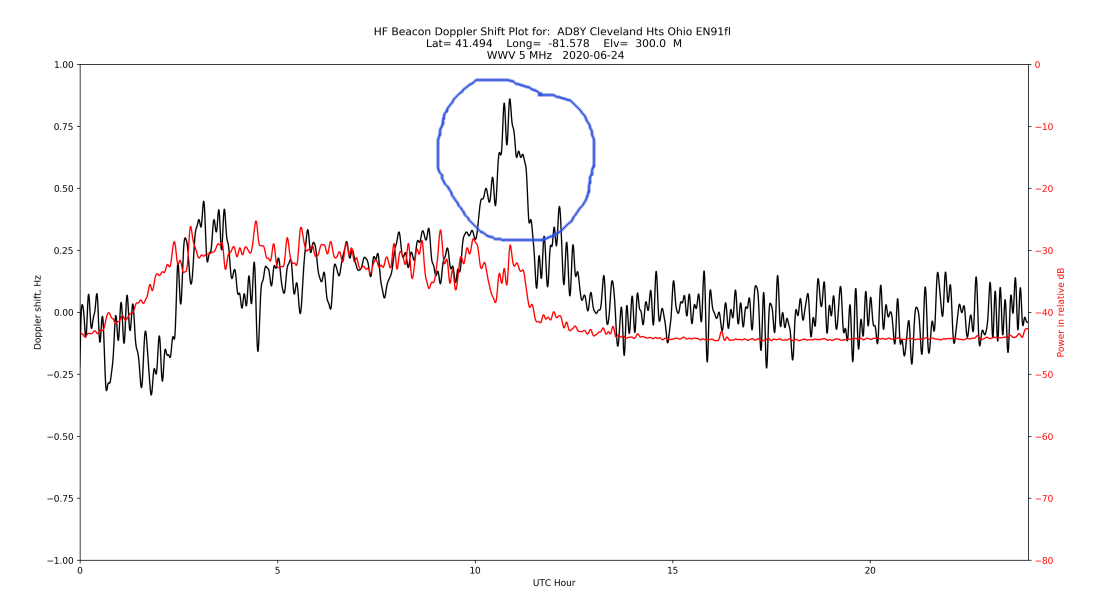
You will see variation day to day. If you plot data over a long period, you will see the morning peak shift with the changing length of day.
A good way to check the fidelity of your data: recruit friends nearby to take data on the same frequencies. This will help separate out local noise in your environment from signals that are geophysical in nature. In the plot below, all the stations are within 5km of one another, and the three stations on the top all have GPSDOs. (Image credit: Wim PA0SLT)
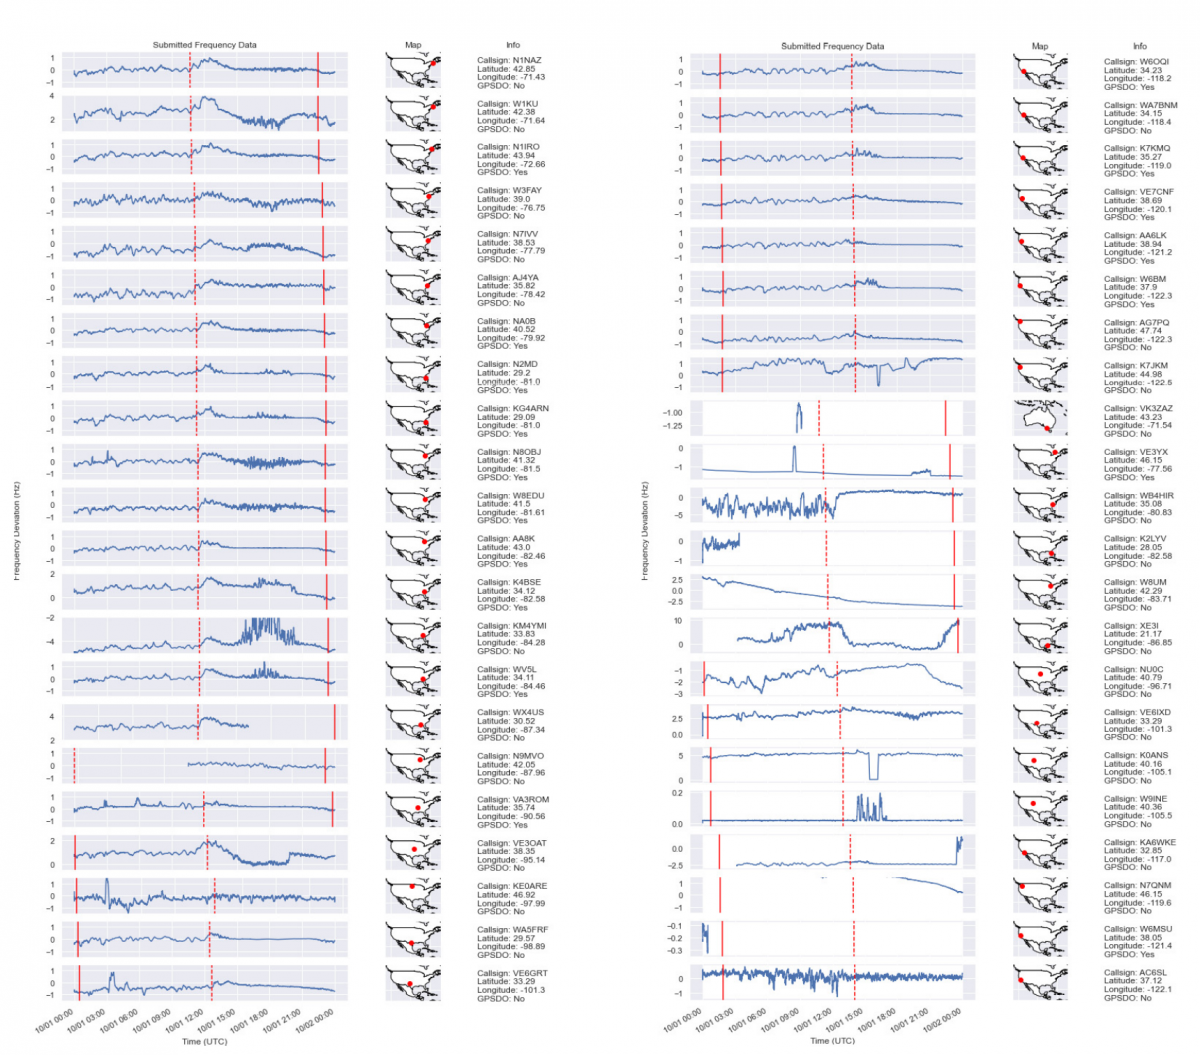
You'll see a lot of regional variation as well. Here's a plot of data taken during the original Festival of Frequency Measurement. You can read about the analysis of the data here.
Frequently Asked Questions
A: Yes. Email hamsci@case.edu and we will help you get your radio set up.
A: Yes, but we cannot provide assistance for other programs. We also like Spectrum Lab, though.
A: More data is always better, but if you need to take your radio back for part of the event (e.g., to run a traffic net) or experience a data interruption, then we're still interested in your data. Just be sure to stop recording before retuning your radio, tune back to 9.999 MHz before you start it up again when you're ready to resume collecting data, and leave us a note when you submit it.
A: Yes, although we can't guarantee we'll be able to use it.
A: Yes! Email me at kd8oxt@case.edu and I'll mail you a thumb drive.
A: WAV files are limited to 4 GB because the filesize is indicated in the header by a 32-bit unsigned int. Audacity will give you another chance to export. Select "Other uncompressed files," then under "Header," select "WAV(NIST/Sphere)." This will use a different header format, but your data should be the same, and can be uploaded as long as it is less than 32 GB.