
June 2020 Eclipse Festival of Frequency Measurement
Thanks to all who collected data for the June Eclipse Festival! We hope you'll join us for our next event, the December 2020 Eclipse Festival of Frequency Measurement.
You can view more information about the results here.
Alternate language options:
Chinese: 简体中文介绍
Spanish: Espanol
Dutch: Nederlands taal
Calling all stations in the Eastern Hemisphere: Join us for
The June 2020 Eclipse Festival of Frequency Measurement
Introduction
Contact information:
Kristina Collins: kd8oxt@case.edu
Research Questions
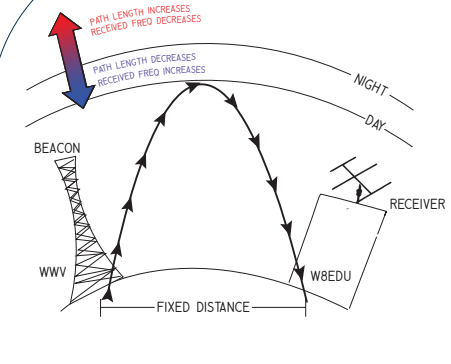
- How do the propagation paths of shortwave time standard stations vary over a calendar day?
- What properties of the ionosphere are we able to measure by observing the variation in these HF propagation paths?
- What effect will the annular eclipse have on these propagation paths?
- How do various measurement techniques for understanding the path variation compare?
- Is there volunteer interest in collecting data in the regions near totality for this eclipse?
Objectives
- Promote international goodwill by working with citizen scientists around the globe
- Measure Doppler shifts caused by space weather's effects on the ionosphere.
- Use a specified measurement protocol available to amateur radio operators and other citizen-scientists.
Times
- Control Day: 14 June 2020, 0000 – 2359 UTC
- Data recording starts: 20 June 2020, 0000 UTC
- Data recording ends: 22 June 2020, 2359 UTC
The Beacons

The beacon station will be BPM, the time service station of the Chinese Academy of Sciences, marked by the blue dot in the map above. BPM broadcasts on 2.5, 5, 10, and 15 MHz. This experiment will use only the 10 MHz transmissions. If you want to participate and cannot record the 10 MHz signal, use whichever frequency you can and make sure the file is labeled appropriately. The recordings in this experiment are expected to show formations of the D-layer at stations' local sunrise and other daily events of the ionosphere, and the effects of the eclipse. Space weather varies day to day and some features may be prominent. We'll see what we get!
Procedures
1) Sign up on the Interest List
Fill out the survey here to sign up.
2) Prepare Your Receiver, Computer, and Software (fldigi)
- Download fldigi, install it, verify that it's working correctly. Find the "frequency analysis" module in the "op mode" pulldown menu.
- Tune your radio (in AM mode) to BPM on 10 MHz, and determine which you can easily measure.
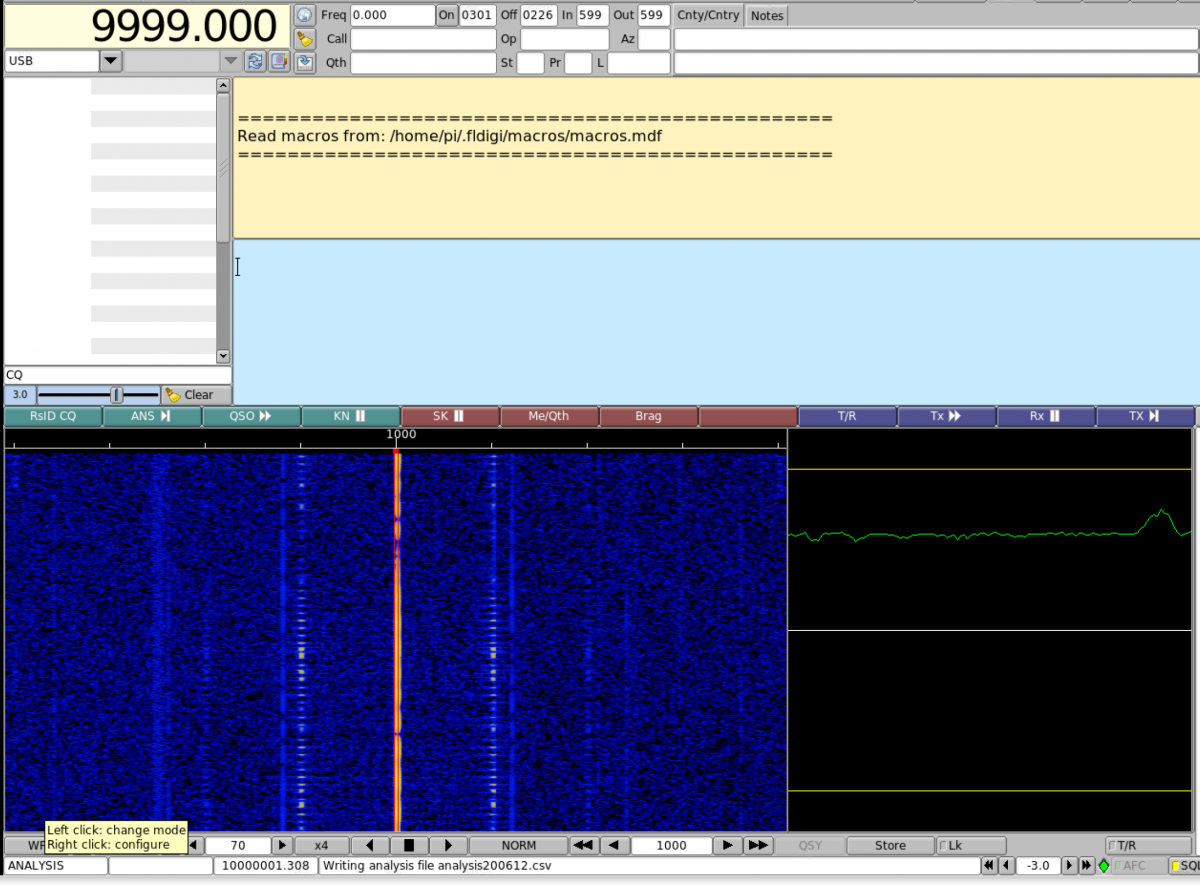
- Set your receiver's mode to USB (upper sideband). For 10 MHz BPM, tune to 9.999 MHz (9999.000 kHz - see image) and listen for the 1000 Hz tone.
- In fldigi, make sure that the tuned frequency in the upper left-hand corner is the same as your radio's frequency. To change it, click on the top half of a digit to increase it or the bottom half to decrease it.
- Look for the 1000 Hz line on fldigi's waterfall. Click the cursor there or use the offset frequency box at the bottom of fldigi's screen. You must set the number in the box at the bottom of the screen to exactly 1000. (If fldigi doesn't take this input properly, try starting the recording and then setting to 1000.)
- In fldigi, select the "Op Mode" menu and select "Freq Analysis" mode.
- Look for "writing CSV file" on the lower line of fldigi, toward the left. If you have a clean signal and see only one carrier, you can stop here.
- If you see multiple carriers, more detailed Doppler information is needed. Go to File>Audio>RX Capture to record your audio signal. Save your file with the current UNIX timestamp and your callsign or name, e.g. "1592282573 - W8EDU.wav". Recording continuously for 3 days will result in a 4.5 GB file, so you may want to pause and restart this process occasionally in order to make sure your computer doesn't run out of space and crash. To restart the process, uncheck the box under File>Audio>RX Capture and then check it again. You will be prompted to save a new file - remember to use the current timestamp so that we can keep track!
- Now, leave fldigi alone.
- At the end of your recording period, close fldigi. The file "analysis.csv" should be in your /fldigi/temp/ directory. Alternatively, they may be under "/fldigi.files/analysis". In MacOS, they are in the hidden directory ~/.fldigi/analysis - to find them, you must unhide the files using CMD + SHIFT + . in Finder.
- Try all this before the day of the event.
3) Collect the data
- Begin Step 1 above at the beginning of your data collection period. There will be a test day on June 14th, and the main data collection will run from 0000 UTC on June 20 to 2359 UTC on June 22.
- During this time, leave your radio alone and make sure your computer is not shut down by an automatic update.
- At the end of the data collection period, you should have three analysis-*.csv files, one for each day of data recording. Please rename these files by adding your name or callsign: e.g., analysis_200620 - W8EDU.csv. Do not edit the content of the files.
3) Upload Via Google Form
Frequently Asked Questions
A: Absolutely. If you're far from the path of totality then we can't guarantee that we'll be able to use your data, but it's always good to practice and we may be interested in working with you in the future.
A: Yes! Get in touch via the link above.
A: Yes. Email hamsci@case.edu and we will help you get your radio set up.
A: Yes, but we cannot provide assistance for programs other than fldigi.
A: Yes, although we cannot guarantee that we'll be able to use your data. You can find a list of international time standard stations here.
A: More data is always better, but if you need to take your radio back for an hour or two during the event (e.g., to run a traffic net) then we're still interested in your data. Just be sure to exit frequency analysis mode before retuning your radio, and tune back to 9.999 MHz before you start it up again when you're ready to resume collecting data, and leave us a note when you submit it.
A: Yes.
A: YES. Email hamsci@case.edu to discuss further.
A: Of course! Eclipse Festival certificates will be mailed to all participants at the conclusion of the experiment.
Media Mentions
Page Contributors: KD8OXT, AD8Y, KB3UMD, N8OBJ
Last edit: 2 June 2020